
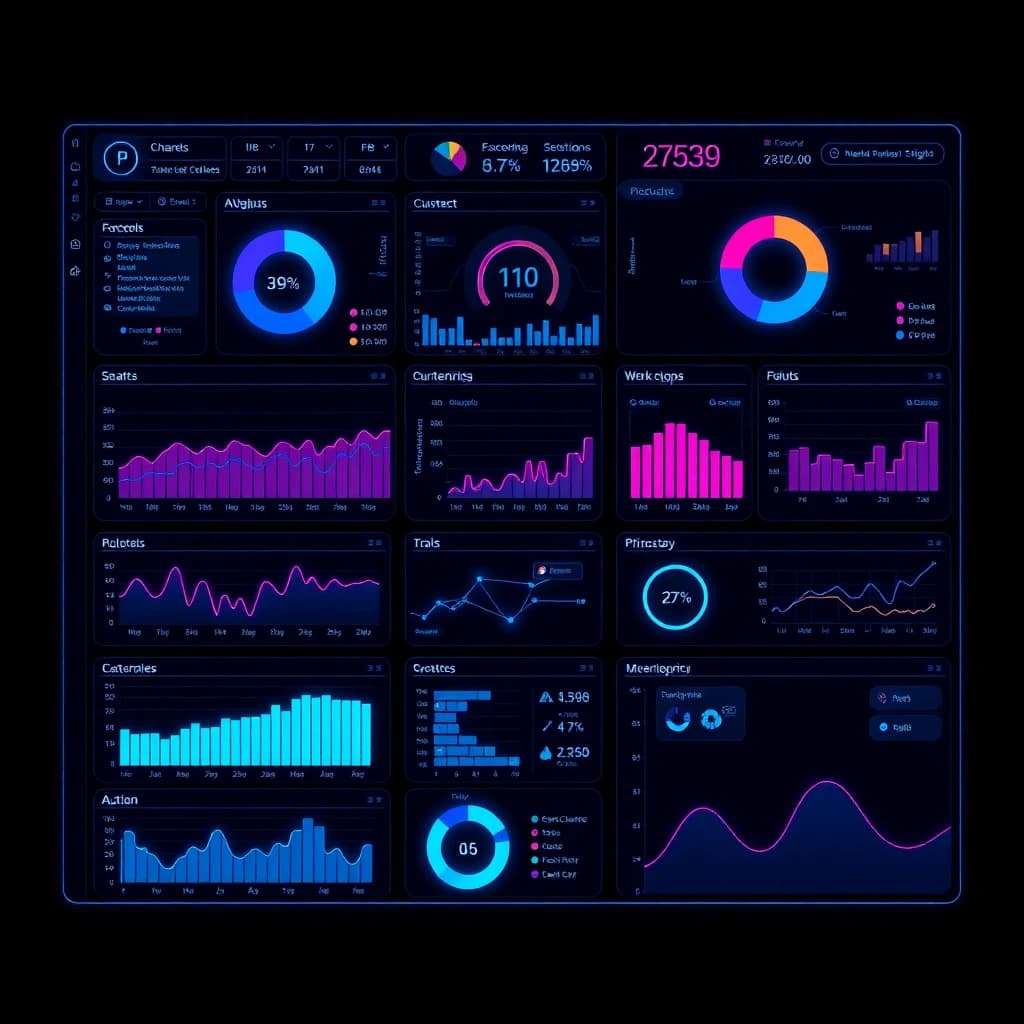
Designing complex dashboards that make data understandable
Dashboard design for business applications: how to prioritise metrics, pick the right charts and build dashboards that make decisions easier for users.
In short: A good dashboard answers the questions its users ask regularly, at a glance. That is why dashboard design starts with the decisions someone has to make, and only then moves on to charts. A few clearly prioritised metrics with reference values, the right chart type and restrained use of colour make even complex data understandable.
Start with the question, then the data
Most cluttered dashboards exist because they show everything the database holds. Ask instead: who looks at this view, how often, and what do they do next? A managing director checking revenue on Monday mornings needs something different from a dispatcher who watches open orders all day.
For each user group, write down the three to five questions the dashboard should answer. Any metric that answers none of them belongs on a detail page or in an export.
Keep operational and strategic dashboards apart
Operational dashboards show the current state and call for quick action: open tickets, stock below minimum, late deliveries. Strategic dashboards show developments over weeks and months. Mixing both in one view makes both worse.
Information architecture: overview first
A well-known principle from visualization research says: overview first, zoom and filter, then details on demand. At the top sit a few metrics that summarise the state. Below them come charts showing trends and distributions. Individual records are one click away.
Metrics with context
A number without comparison says little. "Revenue: EUR 84,000" only becomes meaningful next to last year's figure, the target or the trend of recent weeks. Show the deviation right next to the value and make clear whether it is good or bad. Rising costs are negative, rising revenue is positive.
Reading order and grouping
Users read from top left to bottom right, so the most important information goes top left. Related values sit side by side under a shared heading. Consistent spacing and a fixed grid help the eye more than borders and shadows.
Choosing the right chart
The chart type follows the question:
- Change over time: line chart
- Comparison between categories: bar chart, horizontal and sorted when there are many categories
- Share of a whole with few parts: stacked bar, pie charts only with very few segments
- Distribution: histogram or box plot
- Relationship between two variables: scatter plot
Avoid 3D effects, dual y-axes and gauge graphics that use a lot of space for a single number. Bar charts should start at zero, otherwise small differences look dramatic.
Colour, number formats and accessibility
Use colour on purpose: one neutral base colour for most data and one accent for what deserves attention. Red and green often carry meaning on dashboards, yet people with red-green colour blindness struggle to tell them apart. Always back colour up with icons, labels or patterns. Our articles on the psychology of colour in digital products and web accessibility go deeper.
Format numbers for your audience's locale. German users expect a period as thousands separator, a comma as decimal separator and dates as DD.MM.YYYY. In JavaScript, Intl.NumberFormat handles this reliably. Round sensibly: a revenue tile does not need cents.
Technology: keeping the dashboard fast
A dashboard that takes ten seconds to load will not get used. Compute expensive aggregations in advance, for example as materialized views in PostgreSQL or in a nightly job, instead of summing millions of rows on every page view. Load detail data only when someone asks for it. Show when the data was last refreshed so nobody trusts stale numbers.
Recurring elements such as metric tiles, chart containers and filter bars belong in a design system. That keeps every view consistent and makes new dashboards faster to build.
Frequently asked questions (FAQ)
How many metrics belong on a dashboard?
There is no fixed number, but a rule of thumb helps: as many as someone can take in and compare without scrolling. For the top level, that is usually a handful. Everything else goes on detail pages.
Should we use a BI tool or build a custom dashboard?
For internal reporting, tools like Power BI, Metabase or Grafana are often quicker to set up. A custom dashboard pays off when it is part of your product, when customers see it or when it needs to be tightly connected to workflows inside your application.
How do we test whether a dashboard is understandable?
Give real users concrete tasks, such as "Which branch was below plan last month?", and watch how long they take and where they hesitate. A few sessions are enough. We describe low-cost methods in usability testing on a budget.
Conclusion
Understandable dashboards come from leaving things out: every metric has to answer a real question, and every number needs a comparison. Starting the design from your users' decisions saves a lot of rework later. If you are planning a dashboard or data application as part of your software, we can help with web development for business applications.
Related posts
- Design Systems: Why Every Development Team Needs One
What a design system includes, when it pays off and how tokens, components and documentation help design and development ship faster and more consistently.
- Mobile UX Patterns That Convert: What Good Apps Do Differently
Which mobile UX patterns lead to more sign-ups and purchases in apps: thumb zone, onboarding, forms, permission requests and loading states in detail.
- From Wireframe to Pixel-Perfect: The UI Design Process
How an idea becomes a buildable UI design: requirements, wireframes, prototype, visual design, handoff to development and a shared review in the browser.
- Dark mode implementation: CSS variables, system settings, design
How to build dark mode properly: colour tokens as CSS variables, prefers-color-scheme, a toggle without flashing, contrast, images and common mistakes.